North Star

Industry Facts

World health ranking

Outcomes rank
01
Norway
02
Japan
03
South Korea
04
Iceland
05
Sweden
06
Israel
07
Spain
08
Australia
09
Singapore
10
Switzerland
11
Luxembourg
12
Italy
13
Belgium
14
Ireland
15
Finland
16
Slovenia
17
Denmark
18
Cyprus
19
Austria
20
Netherlands
21
France
22
Germany
23
New Zealand
24
Malta
25
UAE
26
Greece
27
Canada
28
Portugal
29
Czechia
30
United Kingdom
31
Estonia
32
Kuwait
33
Chile
34
Qatar
35
Croatia
36
Albania
37
Poland
38
Maldives
39
Saudi Arabia
40
Costa Rica
41
Montenegro
42
Sri Lanka
43
China
44
Slovakia
45
Bosnia & Herz.
46
Antigua & Barbuda
47
Panama
48
USA
49
Brunei
50
Barbados
51
North Macedonia
.
.
Health Rank
Country
Exp % of GDP
01
Norway
10.6
02
Japan
11.1
03
South Korea
9.1
04
Iceland
9.5
05
Sweden
10.7
06
Israel
7.0
07
Spain
9.7
08
Australia
11.2
09
Singapore
4.9
10
Switzerland
11.5
11
Luxembourg
5.5
12
Italy
8.6
13
Belgium
11.1
Health Rank
Country
Exp % of GDP
14
Ireland
7.1
15
Finland
9.3
16
Slovenia
9.0
17
Denmark
10.2
18
Cyprus
5.6
19
Austria
10.6
20
Netherlands
10.7
21
France
11.5
22
Germany
11.7
23
New Zealand
9.6
24
Malta
10.4
25
UAE
4.7
26
Greece
8.7
Health Rank
Country
Exp % of GDP
27
Canada
11.6
28
Portugal
9.3
29
Czechia
7.6
30
United Kingdom
9.9
31
Estonia
6.9
32
Kuwait
6.0
33
Chile
10.2
34
Qatar
4.2
35
Croatia
7.0
36
Albania
7.2
37
Poland
6.6
38
Maldives
7.0
39
Saudi Arabia
5.8
Health Rank
Country
Exp % of GDP
40
Costa Rica
8.6
41
Montenegro
8.5
42
Sri Lanka
3.9
43
China
5.6
44
Slovakia
7.1
45
Bosnia & Herz.
8.9
46
Antigua & Barbuda
5.0
47
Panama
8.1
48
USA
18.5
49
Brunei
2.3
50
Barbados
5.7
51
North Macedonia
6.6
52
Lithuania
7.2

USA health spend & global rank, 1975 to 2025

TOP TEN TARGET
USA RANK ; GLOBAL HEALTH OUTCOMES
TOP PERCENTAGE TARGET

USA health spend & global rank, 2035 target

TOP TEN TARGET
USA RANK ; GLOBAL HEALTH OUTCOMES
TOP PERCENTAGE TARGET

USA vs. others (sample countries)

Category
Norway
Singapore
Greece
USA
World Rank (Outcomes)
1
9
26
48
Health Spend as a Percentage of GDP
8%
5.6-6%
8.5%
18.5%
Per Capita Spend ($USD)
$8,700
$4,300
$1,800
$16,600
Life Expectancy, Years
82.9
83.9
79.6
76.4
Healthy Life Expectancy, Years
71.2
73.6
68.6
63.9
Maternal Mortality per 100K Live Births
1.3
6.1
4.8
16.6
Under Age 5 Mortality
2.4
2.1
3.7
6.5
PREMATURE NCD MORTALITY
7.8
10.3
12.0
13.7

How we spend $5.6 Trillion, 18.9% of GDP

Hospital care
32.1%
Physician & clinical services
20.1%
Residential, home, nursing & retirement care
12.9%
Dental, public health, other professional services
10.9%
Prescription drugs
9.5%
Net cost of health insurance
7.4%
Other (DME, admin, research, structures & equipment, other 3rd-party)
7.1%

The path from $5.6 to $2.9 Trillion; extract $2.6 Trillion

Examples of structural reforms and potential savings

Roadmap to eliminating System Waste, 57% of goal

Challenges to be solved

Use data to

0%

Teriflunomide (drug)

$371.30 Cost Plus Drugs cash price. $10,239.69 paid by J&J plan, 96% savings

0%

Hip replacement

$18,000 bundled vs. $75,000+ at academic centers, 76% savings.

0%

Knee surgery in NYC

$5,200 vs. $50,000 — same ZIP code zip code, 90% savings

0%

MRIs in NYC

$340 to $3,600, even with the same insurer, 91% savings

0%

Spinal fusion

$45,000 at specialty centers vs. $250,000+ elsewhere, 82% savings.

These aren’t outliers—they’re systemic. The U.S. healthcare system rewards opacity, not outcomes. The fix is simple: let clinical evidence and transparent cost data drive decisions.

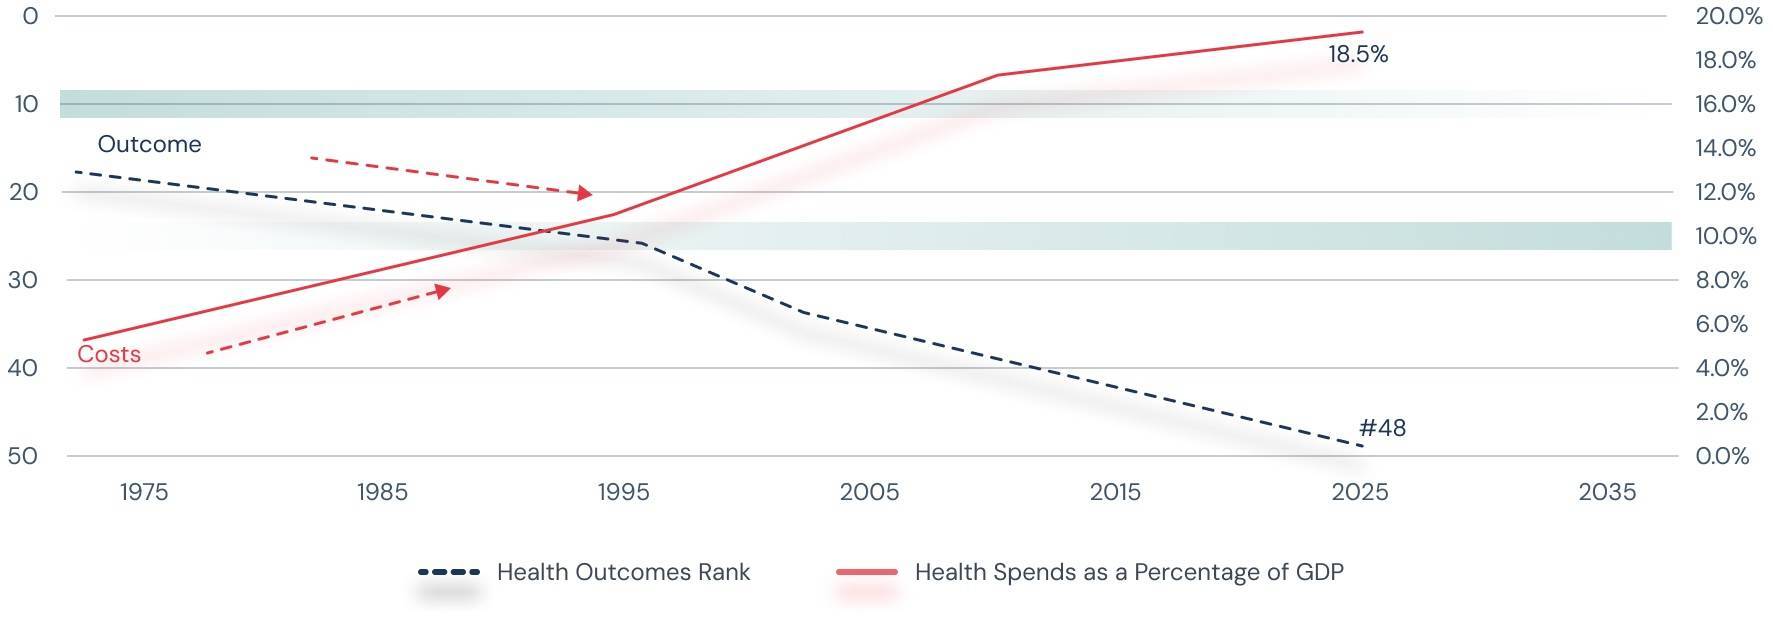
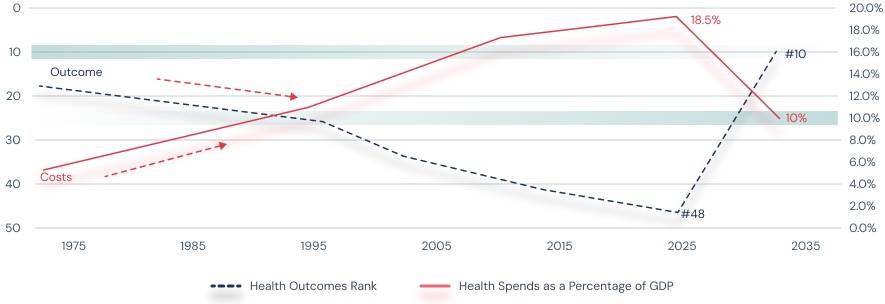
The cost of inaction

U.S. healthcare spending will easily exceed $7 trillion/year by 2035, if current trends continue
Life expectancy and other health metrics could continue to fall
Inequities will widen, bankruptcies will rise, and employers will face unsustainable costs

What it looks like to win

Better health outcomes would mean